Gallery
Your Web Browser with an R/Python Engine
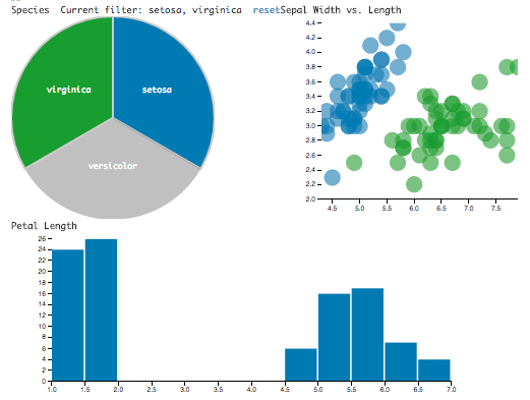
Interactive Data Analysis
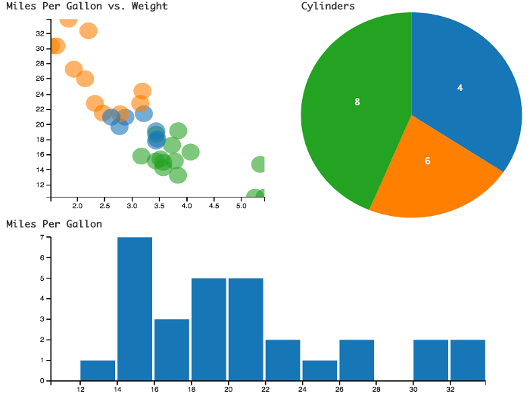
Easily create interactive plots with rcloud.dcplot; based on the dc.js Javascript library which leverages D3.org.
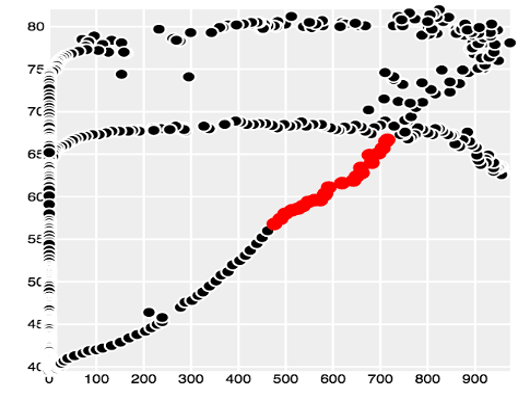
New Graphics Capabilities.
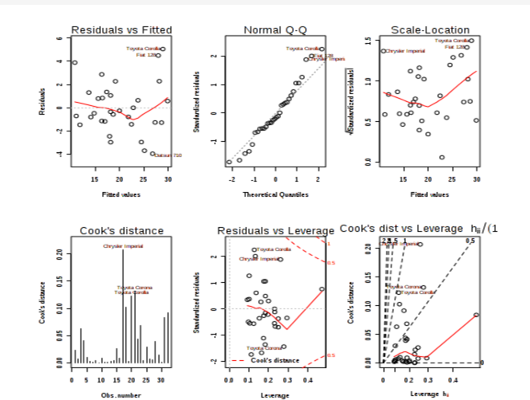
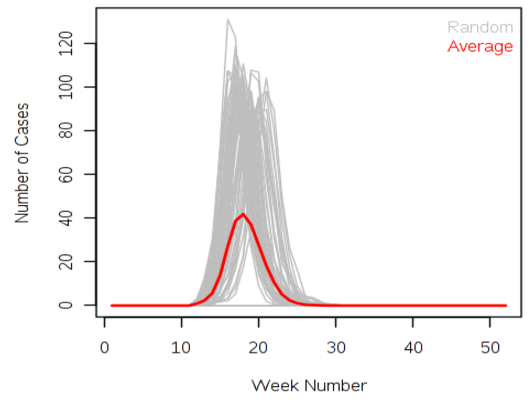
Additional native visualization capabilities, including plot interaction, resizing and multiple format storage.
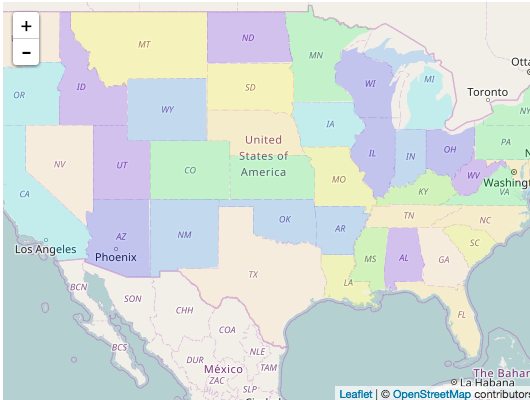
Easy Map Integration
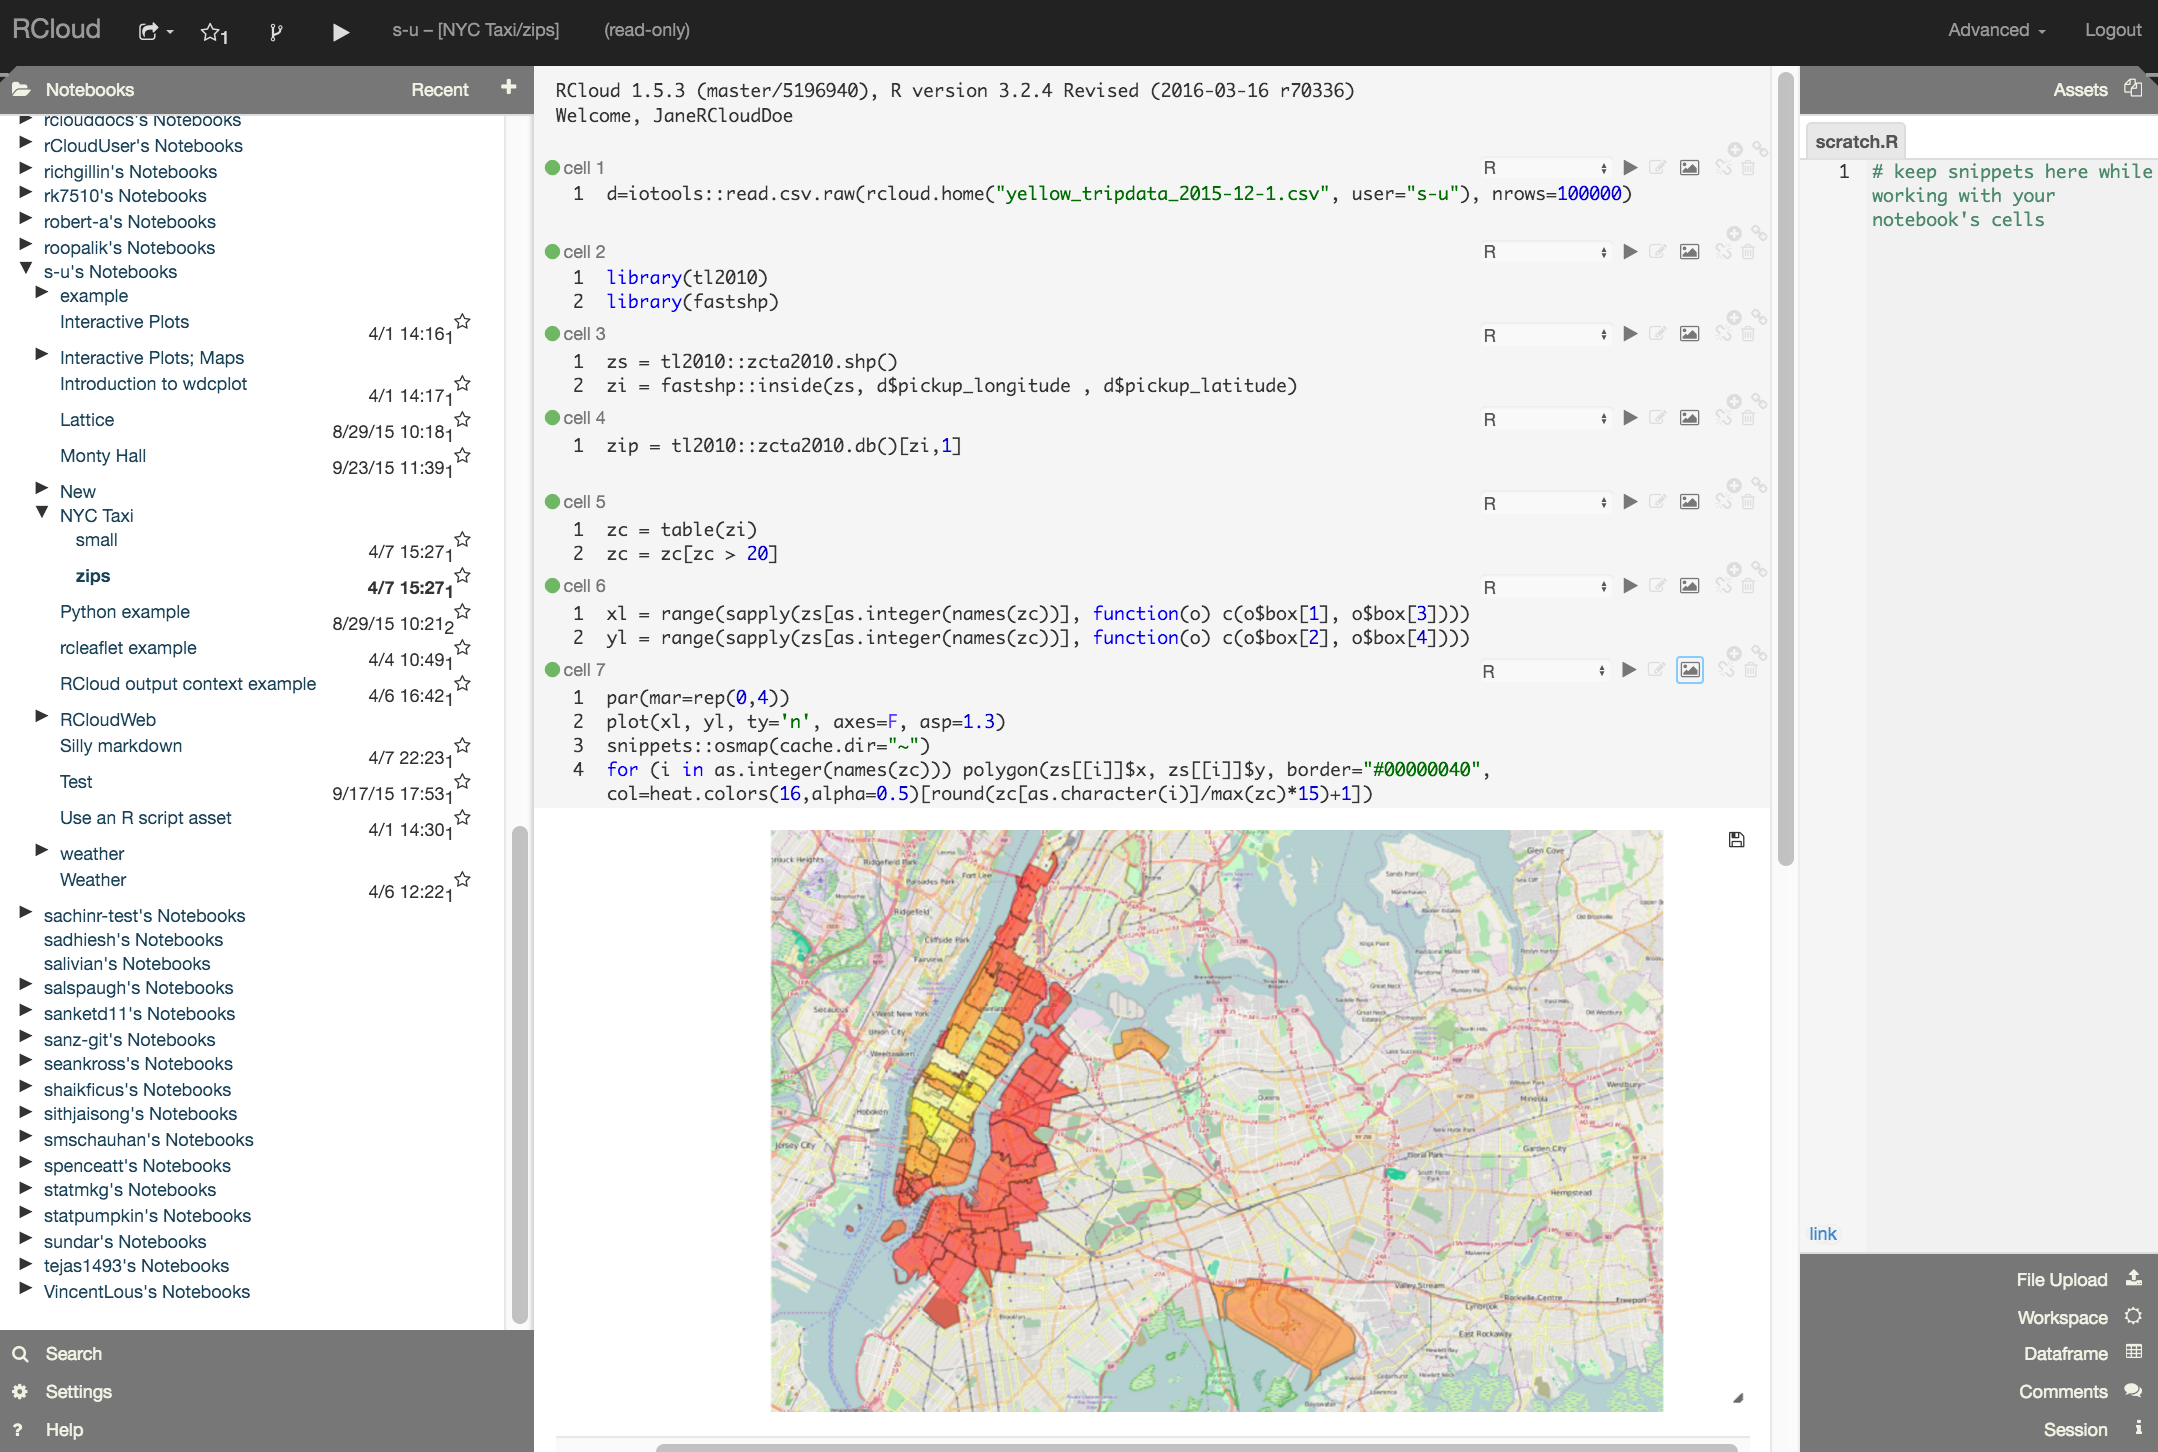
For rich, interactive location analytics, take advantage of HTML Leaflet Widget.
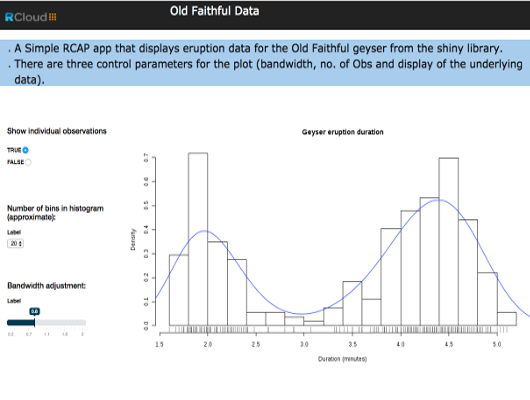
RCloud Designer (RCAP)
Create interactive charts and dashboards using drag and drop widgets through RCloud's Analytic Platform (RCAP).
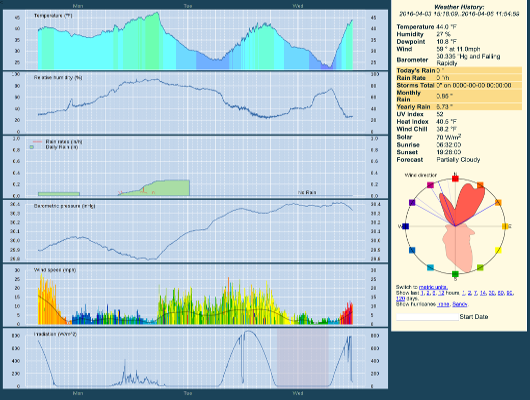
Intelligent Dashboarding
Use RCloud's unique flexible notebook.R interface as the building block for any complex big data visualization.
Getting Started
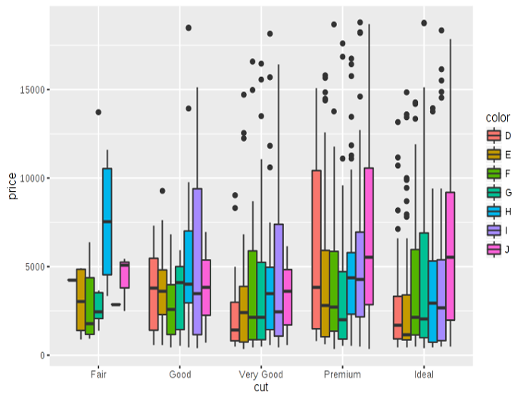
Prompt and Markdown Cells
Create publishable quality reports and data analyses that may be shared with others.
Data Analysis
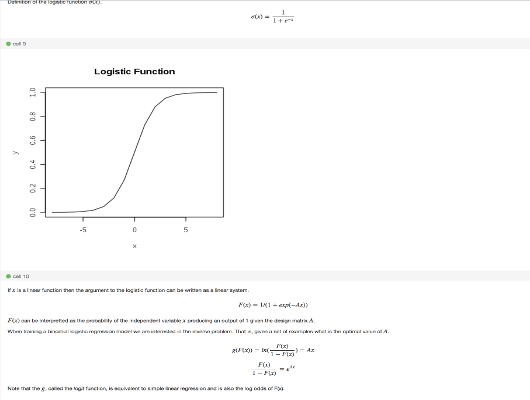
Credit Card Loss
RCloud for Comprehensive Capital Analysis and Review (CCAR) modeling and documentation.
Dashboarding
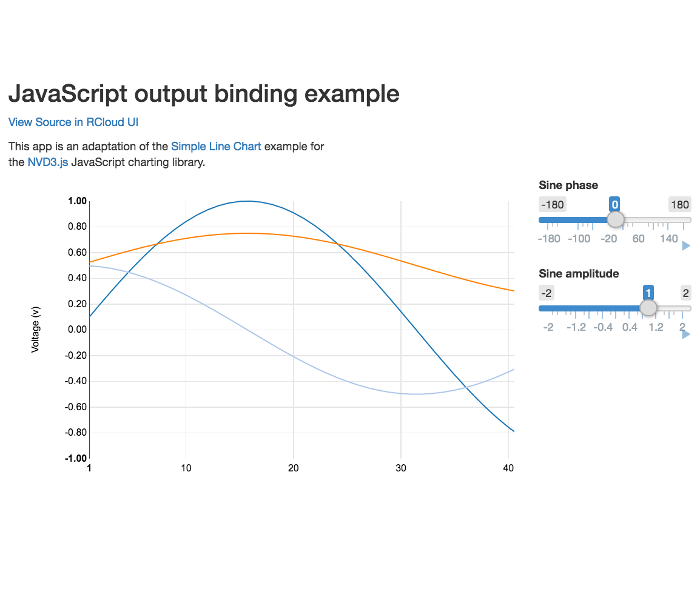
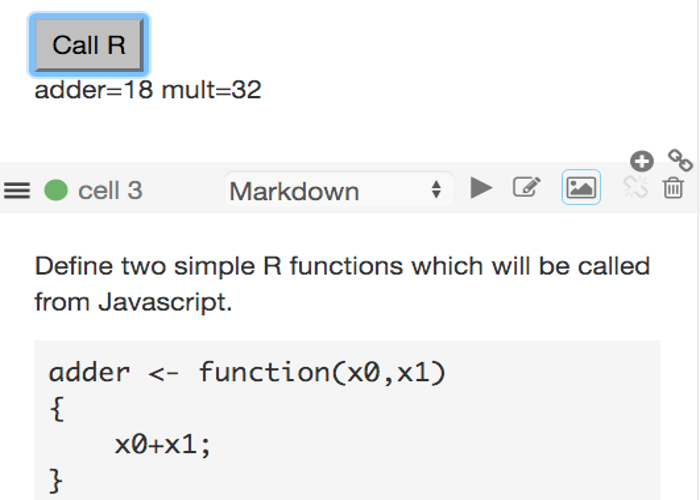
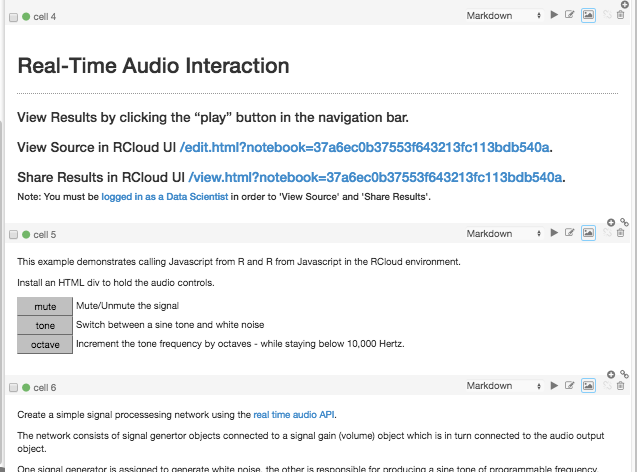
JavaScript Integration
Combine RCloud API, Shiny API and NV D3.org JavaScript library to create interactive analyses.
Extending Interaction
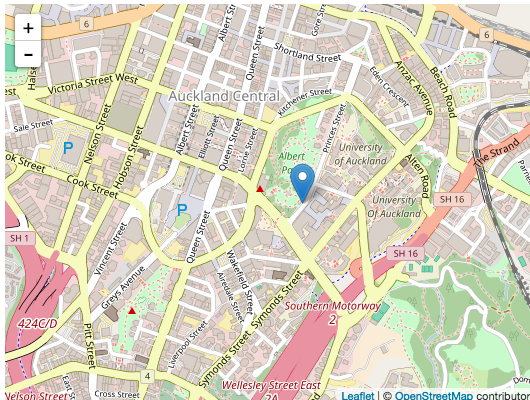
Interactive Plots
Draw a map with some basic features, including specifying zoom level, centering and adding points using Leaflet.
HTML Widgets
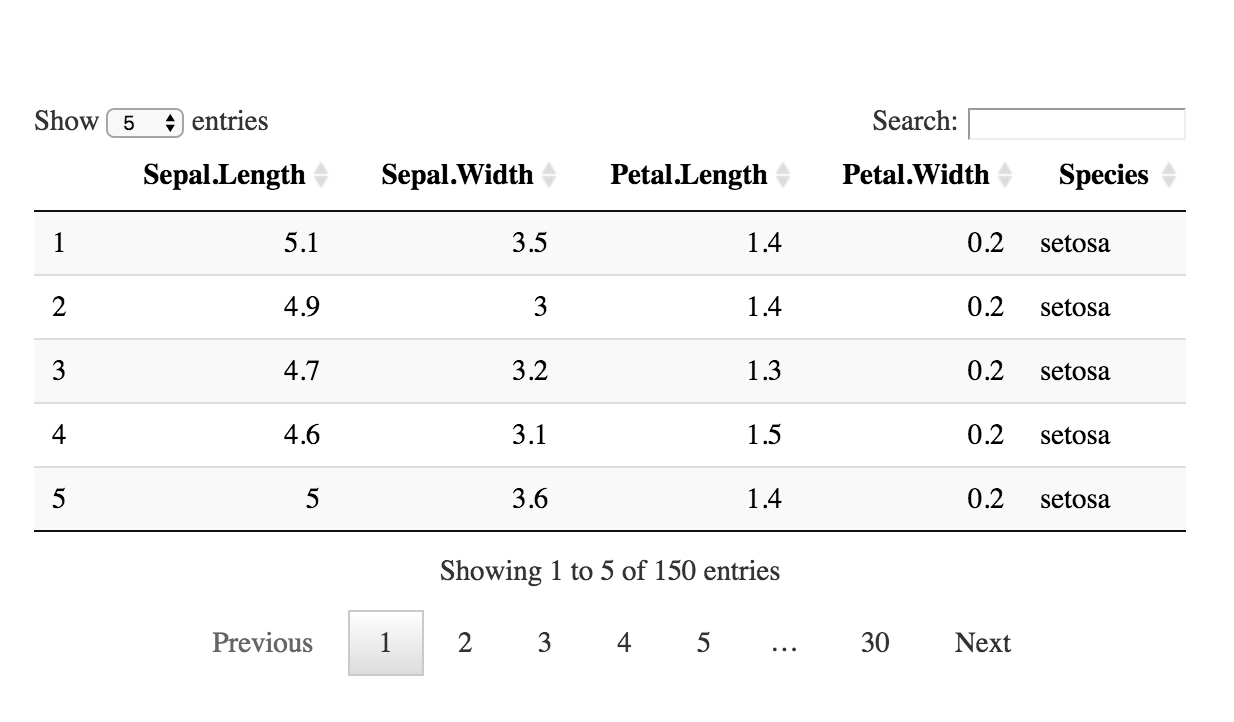
DataTables
DataTables displays R matrices or data frames as interactive HTML tables that support filtering, pagination, and sorting.
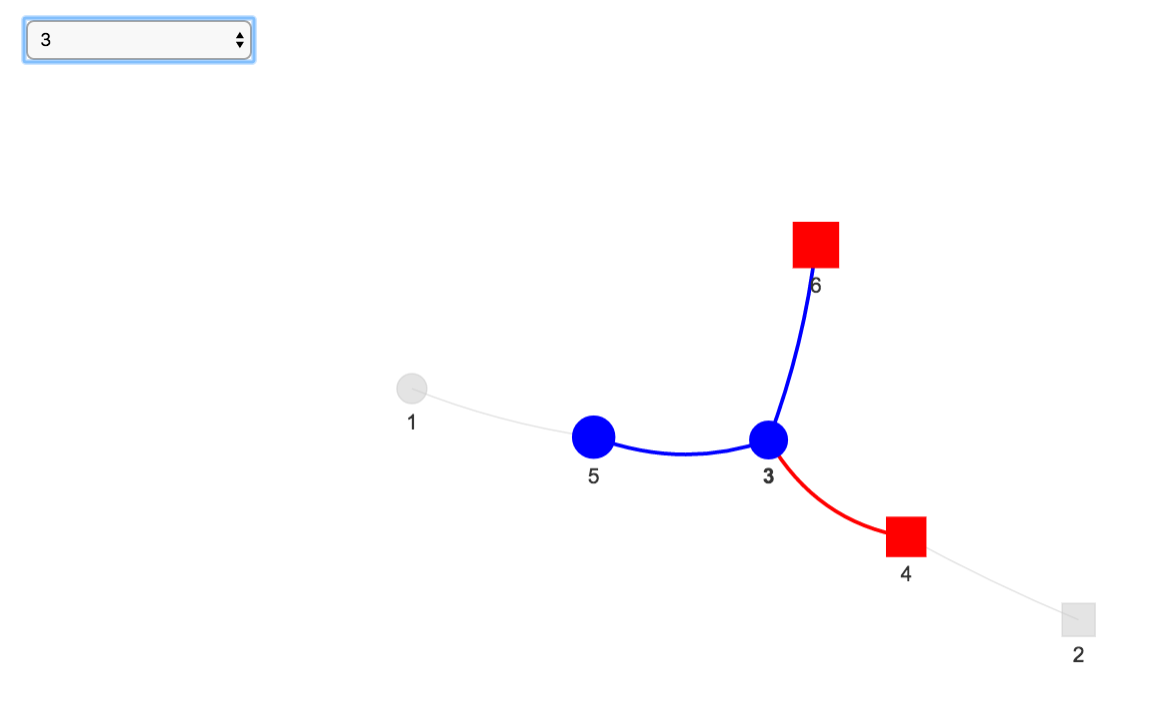
visNetwork
visNetwork provides an interface to the network visualization capabilties of the vis.js library.
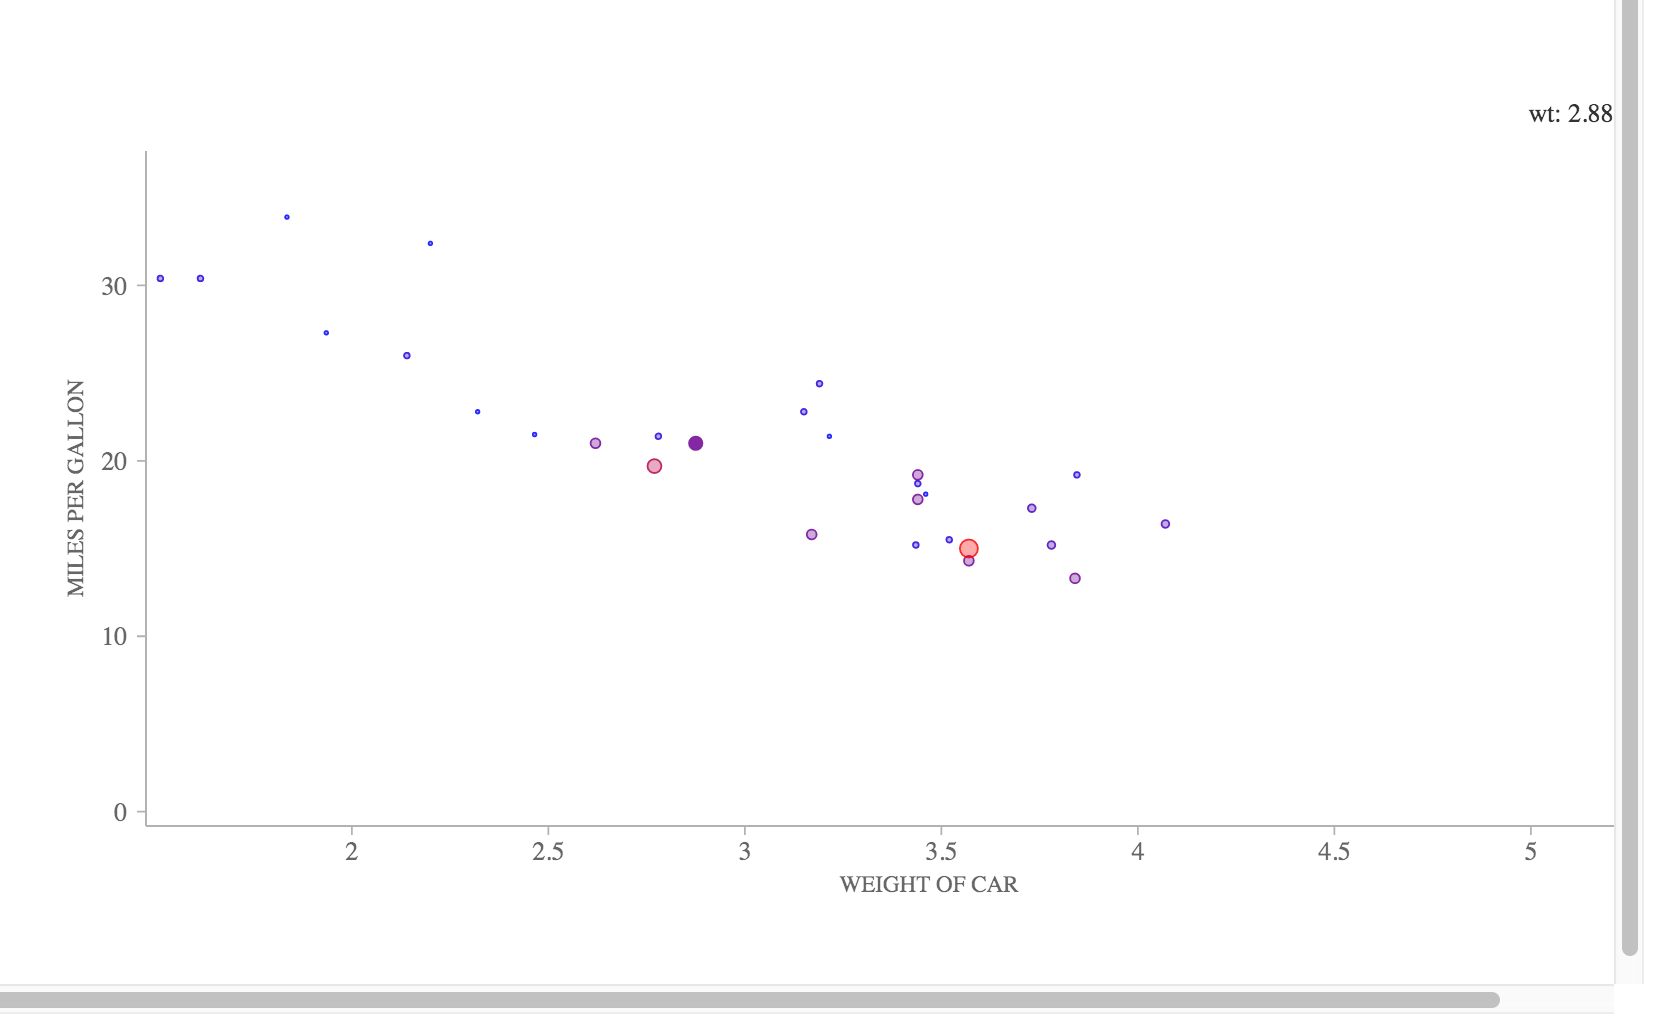
MetricsGraphics
MetricsGraphics enables easy creation of D3 scatterplots, line charts, and histograms.
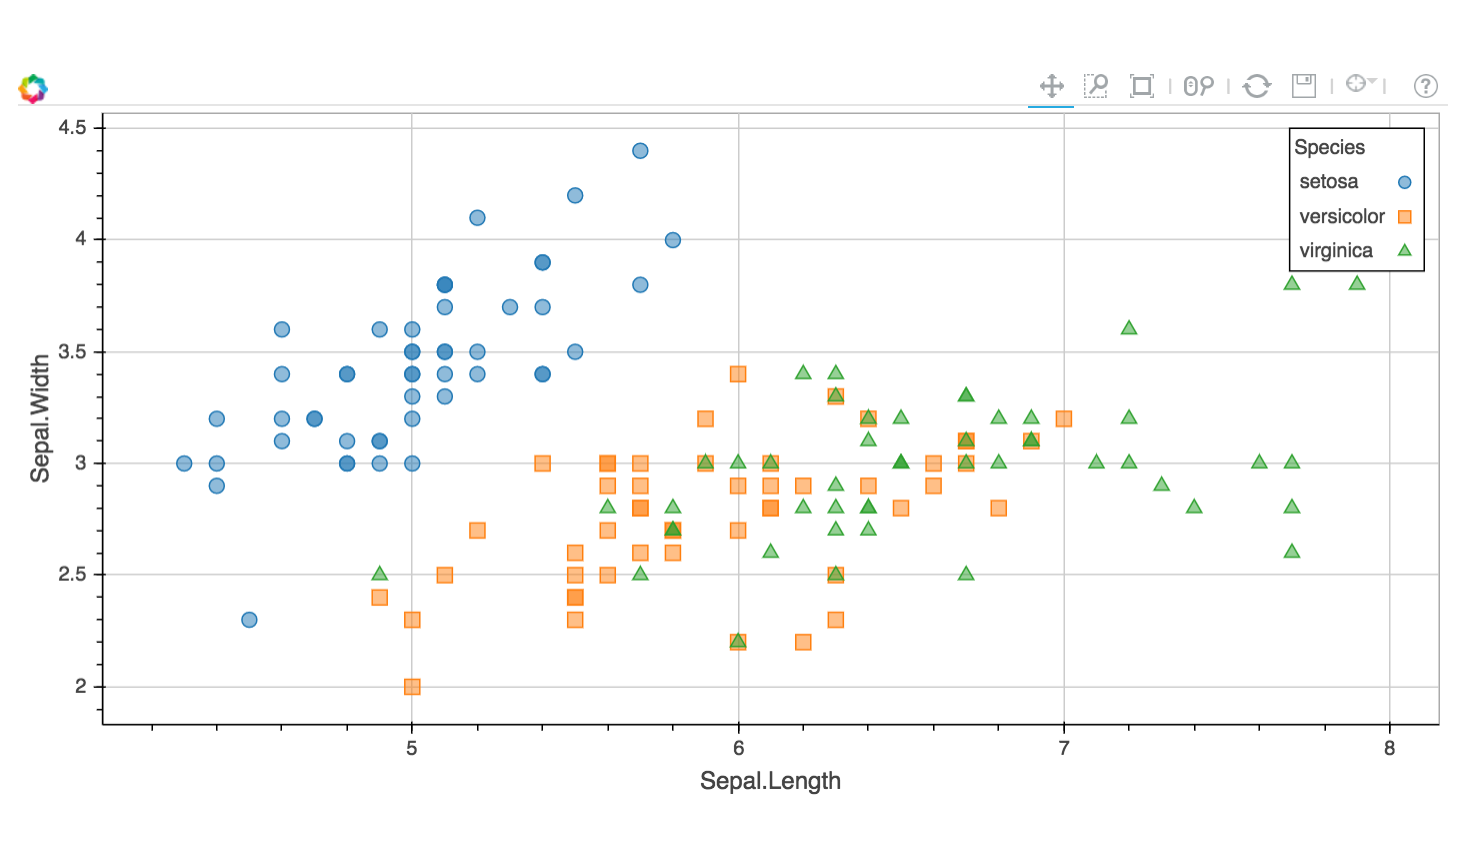
R Bokeh
Bokeh is a visualization library that provides a flexible and powerful declarative framework for creating web-based plots.

